Salient Dashboards Help Center
Welcome to Salient Dashboards, the dynamic, web-based solution for getting the information needed to improve performance and efficiency. This help center explains how to view and explore interactive dashboards of business intelligence.
|
What's New: Version 8.6 provides new ways to visualize data, including bubble charts, color scatter plots, integrated views of pass/fail numbers with data values, and more. Other enhancements make dashboards easier to use.
|
Get started
|
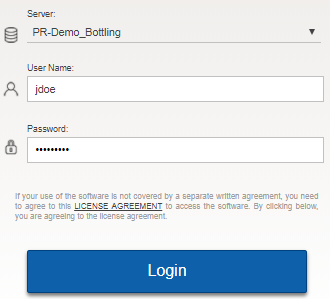 |
External/SSO authentication: Click the SSO Login button. If you are not already logged in, the next screen will allow you to enter your user name and password and Sign in.
LDAP login (i.e., machine login used for authentication): The user name and password entries may not be needed.
The first screen will typically be a portal dashboard that provices fast and easy access to dashboards.
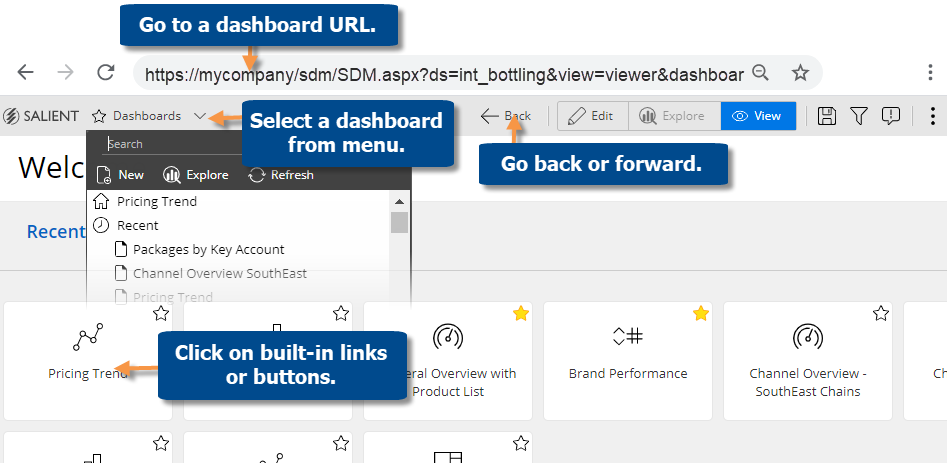
Open a dashboardOpen a dashboard
After logging in, use any of the following methods to open a dashboard:
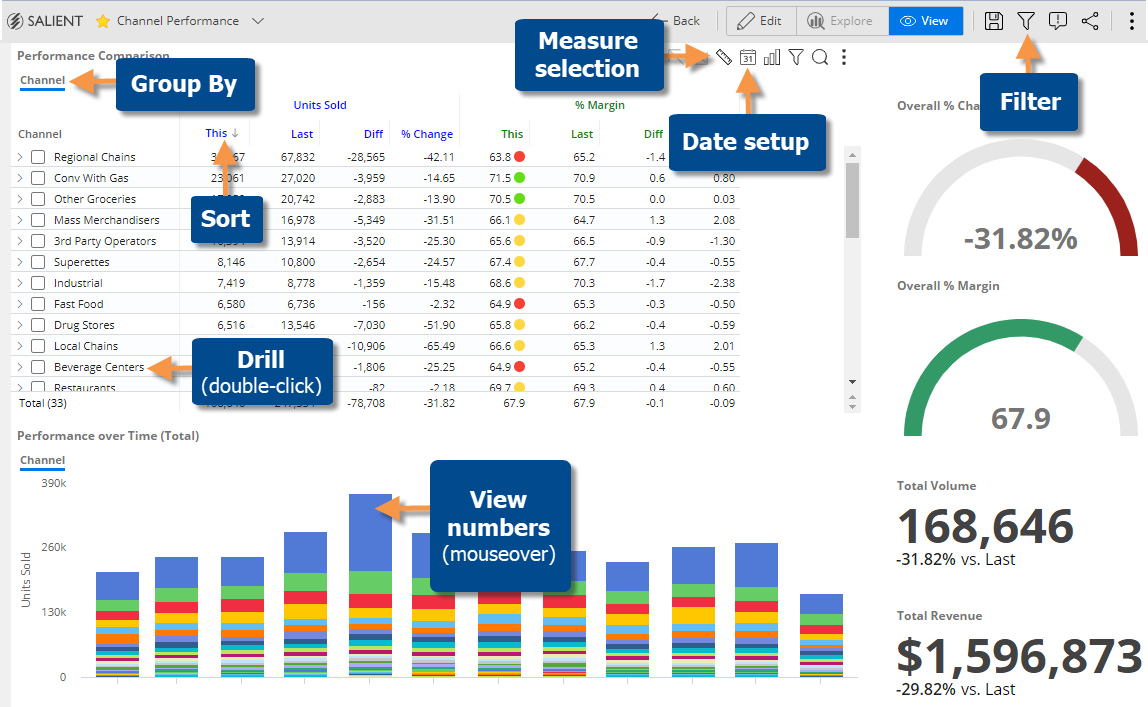
View a dashboardView a dashboard
Opening a dashboard typically takes you to view mode where you can interact with the data and make some changes, such as measure selection, date setup, filters, sorting, and more—depending on how the dashboard was set up.
Explore mode provides additional capabilities for data investigation beyond those available in view mode. You can change the analysis type, access advanced settings, apply highlighting, and more.
|
To start exploring, click Select Explore From Here. |
|
|
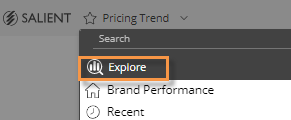
Tip: If you prefer, you can use a default starting point for exploring. Select Explore on the dashboards menu. |
 in the upper-right corner of a widget (visible on mouseover) to open the menu.
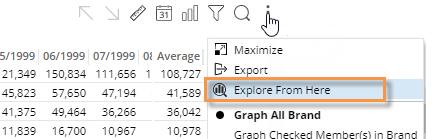
Browse help topics
| View mode | Filter |
| Grid and graph formats | Visual options |
| Measure selection | Explore mode |
| Insert variance | Data analysis types |
| Date setup | Share |
| Group By attributes | Knowledge Manager |
© 2012-2024 Salient Corporation. All rights reserved.
Modified 2024-02-07