Waterfall graph
The Waterfall graph shows a calculated measure and its components. The following formats are available:
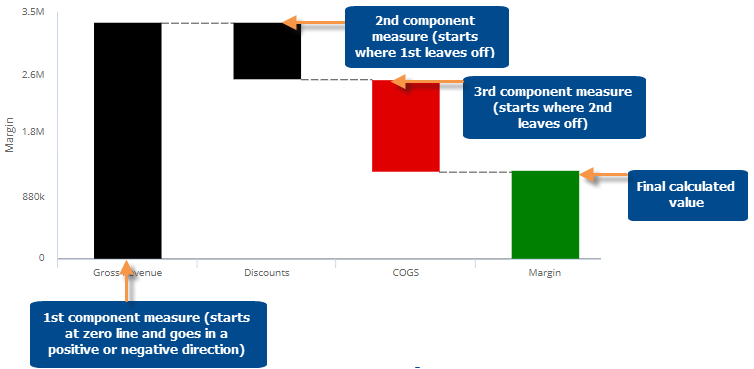
The Actual Value Waterfall graph shows how a calculated measure is increased or decreased by each of its component measures for a single date range. The last bar represents the final calculated value. The preceding bars show each of the component measures in the calculation. The graph makes it easy to see how much each component impacts the calculated value.
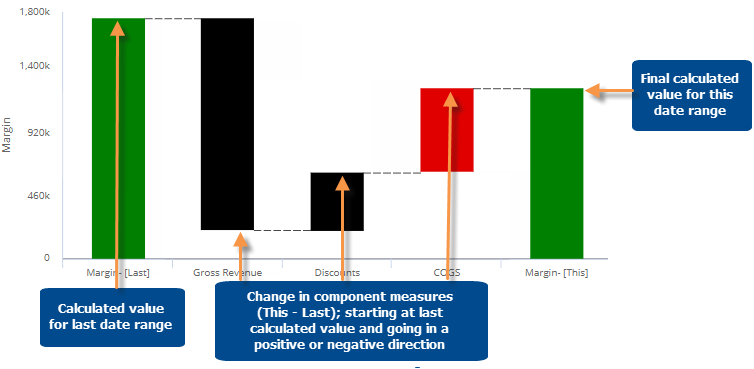
The Difference Waterfall graph shows a calculated value for two date ranges, and how much each of the component measures affected the change. This graph makes it easy to see what component values have changed the most/least and, therefore, affected the final value.
|
Waterfall graph options |
Explanation |
|
Actual Value or Difference |
Click |
|
This only or Last only (only for actual value graphs) |
Click
 in the upper-right corner and choose the
timeframe(s) for which you want to display data. in the upper-right corner and choose the
timeframe(s) for which you want to display data. |
|
Normal or Reverse |
Click |
|
In graph settings (in explore mode): Show labels |
You can turn on/off labels using the Enable Data Labels option under graph settings. The labels show the values or difference for the calculated and component measures. |