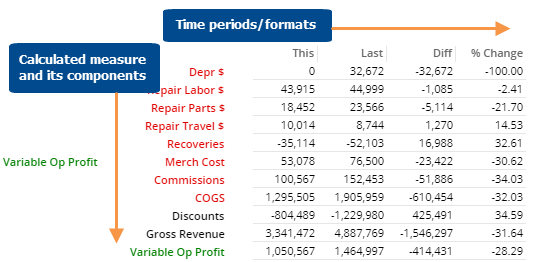
Waterfall grid
The Waterfall grid shows a calculated measure and each of its component measures. It includes columns for This date range, Last date range, difference, and percent change.
|
Waterfall grid options |
Explanation |
|
Difference, percent change, mix, etc. |
You can insert these columns by placing your cursor over a heading (e.g.,
This), clicking the menu icon
 ,
and selecting the column to add. ,
and selecting the column to add.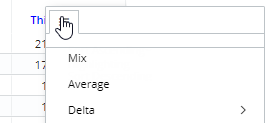 |
|
In settings (in explore mode): |
|
|
- Scorecard or scorecard swapped |
The standard grid shows measures in rows. You can swap columns and rows in the grid types area in grid settings. |