Grid types
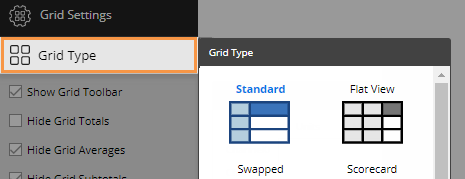
The grid type affects the layout of columns and rows. In addition, some grid types affect the format of graphs when auto-expand is on. To change the grid type, go to Grid Settings in the toolkit and click on Grid Type. In explore mode, you may need to check Advanced at the bottom of the toolkit to see these settings. The available types depend on the selected widget.

|
Grid type |
Example |
Explanation |
|
Standard
|
|
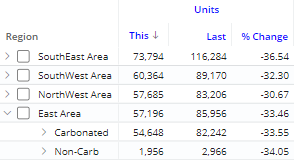
In general, a standard grid shows measures in columns and members in rows. Expanded dimensions will be in a "tree." |
|
|
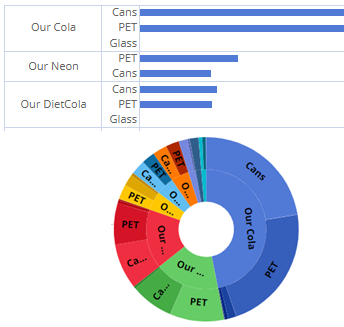
In graphs with auto-expanded dimensions, the standard grid type will cause members to be grouped under the parent category. |
|
|
Flat view
|
|
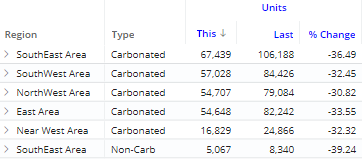
The flat view grid is like the standard format except it places expanded dimensions in separate columns so rows can be treated independently. |
|
|
In graphs with auto-expanded dimensions, the flat view displays combinations of members in a single level. The combinations can be sorted independently. |
|
|
Swapped |
|
In a swapped grid, columns and rows are switched. |
|
Scorecard |
|
The scorecard grid shows measures in rows and timeframes (This, Last, difference, etc.) in columns; does not compare members. |
|
Scorecard swapped
|
|
The swapped scorecard shows measures in columns and timeframes (This, Last, difference, etc.) in rows; does not compare members. |


