Reference lines
You can add custom lines to enhance data visualizations. Custom lines can show thresholds, important dates, and calculated values such as averages, totals, moving averages/totals, cumulative values, and projections.
|
To add reference lines |
|
|
|
 in the graph legend (visible on mouseover).
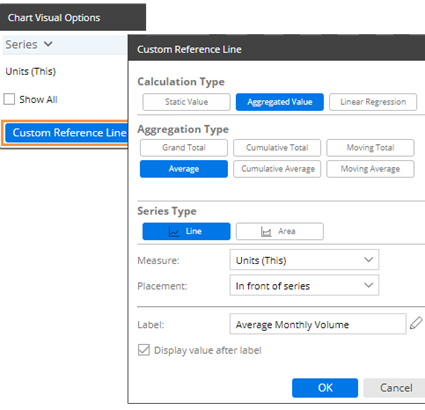
|
Reference line examples |
Recommended settings |
|
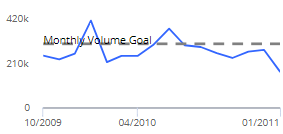
Compare values to a fixed, user-defined threshold: Over time in time-series:
|
Calculation Type - Static Value Series Type - Line for a single value, or Area for a range between two values Measure - Select the measure/format where you want to place the reference line. Axis - Y Value or From/To - Enter a static value. For a shaded area, enter the start value and the end value. Placement - Place the reference line in front or behind the data. Label - Optionally, enter a label for the line. Display value after label - Check the box if you want to include a label showing the value of the line. |
|
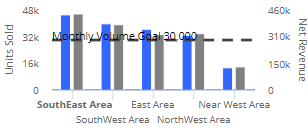
Compare values to a fixed, user-defined threshold: Across members in comparative:
|
Calculation Type - Static Value Series Type - Line for a single line, Area for a range between two values, or Column for a separate column at the end of the graph Measure - Select the measure/format where you want to place the reference line. Y Value or From/To - Enter a static value. For a shaded area, enter the start value and the end value. Placement - Place the reference line in front or behind the data. Label - Optionally, enter a label for the line. Display value after label - Check the box if you want to include a label showing the value of the line. |
|
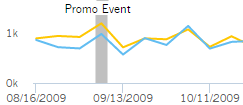
Important dates on a time-series
|
Calculation Type - Static Value Series Type - Select Line for a single date or Area for a range of dates. Measure - This setting is ignored. Axis - X Value - Click the date control(s) and select a single date (for Line) or the beginning and ending dates (for Area). Placement - Select to place the reference line in front or behind the data. Label - Optionally, enter a label for the line. Display value after label - Check the box if you want to include a label showing the value of the line. |
|
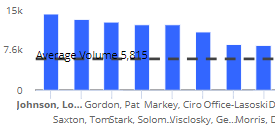
Calculated average or total over multiple members (e.g., average volume per sales rep)
|
Calculation Type - Aggregated Value Aggregation Type - Grand Total of all members, or Average of all members Series Type - Line for a line indicating the average/total, Area for a solid area starting at zero and going to the average/total, or Column for a separate column at the end of the graph. Measure - Select the measure/format for which to calculate averages or totals. Placement - Select to place the reference line in front or behind the data. Label - Optionally, enter a label for the line. Display value after label - Check the box if you want to include a label showing the value of the line. |
|
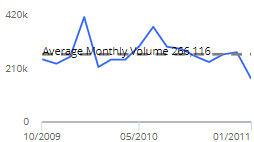
Calculated average across dates (e.g., average volume per month)
|
Calculation Type - Aggregated Value Aggregation Type - Average Series Type - Line for a single line indicating the average, or Area for a solid area starting at zero and going to the average. Measure - Select the measure/format for which to calculate averages or totals. Placement - Select to place the reference line in front or behind the data. Label - Optionally, enter a label for the line. Display value after label - Check the box if you want to include a label showing the value of the line. |
|
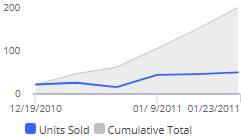
Cumulative average or total over date range (e.g., cumulative volume over time); see cumulative examples
|
Calculation Type - Aggregated Value Aggregation Type - Cumulative Average or Cumulative Total Series Type - Line, Area, or Columns Measure - Select the measure/format for which to calculate averages or totals. Label - Optionally, enter a label. |
|
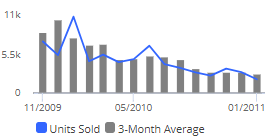
Moving averages or totals for a set number of prior dates; smooths data fluctuations; see moving examples
|
Calculation Type - Aggregated Value Aggregation Type - Moving Average or Moving Total Series Type - Line, Area, or Columns Measure - Select the measure/format for which to calculate averages or totals. Duration - Select the number of prior dates to include in the calculation. Label - Optionally, enter a label. |
|
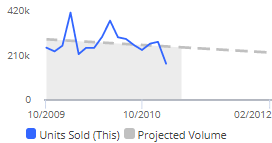
Calculated trends with future projections
|
Calculation Type - Linear Regression Series Type - Select Line or Area. Measure - Select the measure/format for which to calculate projections. Projection Duration - Select the number of future dates for which to project data based on a linear regression. The resulting graph will show the selected date range plus the selected number of projected dates. Placement - Select to place the reference line in front or behind the data. Label - Optionally, enter a label. |
|
Scattergram quadrants based on averages
|
Calculation Type - Aggregated Value Aggregation Type - Average Series Type - Line Measure - X Axis Measure Repeat for the Y Axis Measure. |