Geo widget
|
Geo Overview |
|
|
Description |
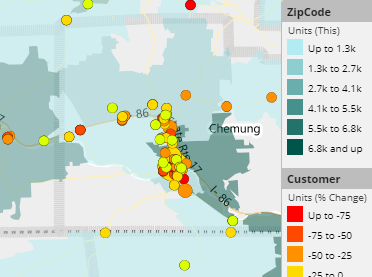
Map showing data values and/or change since another date range |
|
Example |
|
|
Date setup |
This widget shows results for one or two date ranges. Click on |
|
Measures |
To add measures, click the Measures area of the toolkit (in explore mode). You can then use any of the selected measures to control the size and/or color of the points and/or map areas. To access the geo setup areas, click the legend. |
|
Group By/ Filter By |
This widget aggregates data rather than comparing separate groupings. Filters may be applied. |
|
Formats |
Geo-coded points, colored and sized by metric Geo area map colored by measure Map showing points and areas |
 in the widget toolbar (visible on mouseover) and select from pre-configured or custom options for "This"
|
Tips: |
|
Map background layers are pre-configured by your administrator. |
|
The toolbar on the left side of the map (on mouseover) allows you to zoom, select members, and more. |
|
You can mouseover the legend to show the number of members in each range.
|