Member coloring
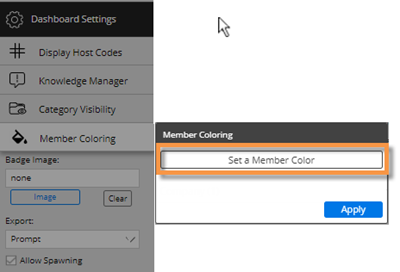
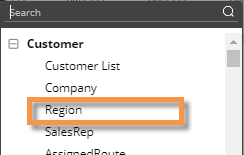
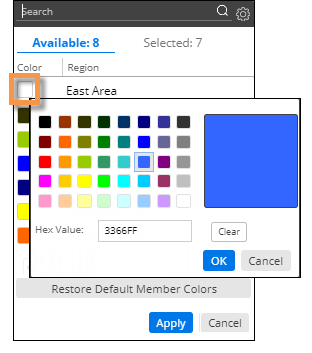
You can assign custom colors to specific dimension members to enhance visual understanding in some types of graphs. For example, you might assign blue to represent a certain region. The colors will be applied consistently in all applicable widgets, which include Mix, Share Trend, and some Crosstab graphs (see the following tips), within the dashboard. For members with assigned colors, the member coloring will override the color palette. Member colors do not carry over from one dashboard to another; however, you can import settings for member coloring.
|
To apply member coloring |
|
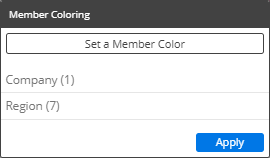
Tip: This menu shows a summary of the member colors that have already been defined. You can click on a dimension to edit its colors.
|
|
|
|
|
|
|
|
|
Tips: |
|
|
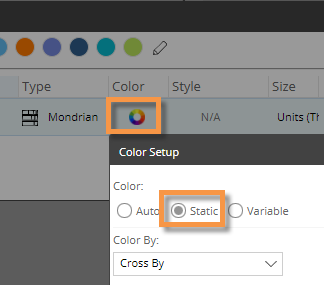
Only Mix, Share Trend, and Crosstab graphs with static colors show member coloring, because other types of widgets use coloring to represent measures, percent change, pass/fail, etc. To turn on static colors for a Crosstab so that member coloring can be utilized, go to its color setup in Visual Options. |
Crosstab static coloring (in visual options):
|
|
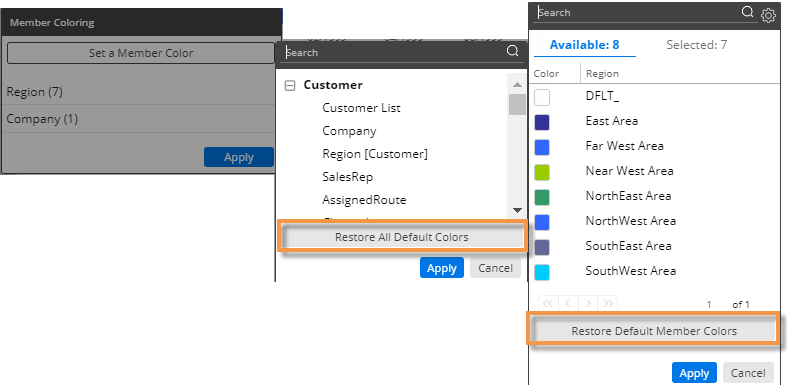
You can restore the default colors for any or all dimensions. This will delete the color settings. To restore default colors for all dimensions, click Restore All Default Colors. To restore default colors for one dimension, click Restore Default Member Colors.
|
|
 at the bottom of the toolkit.
