Benchmarking
Benchmarking allows you to compare the performance of any part of your organization to other parts that represent standards and industry bests. In Salient Dashboards, you can dynamically benchmark performance of whatever is selected against "all", "all others", or custom peer groups (i.e., cohorts) using advanced options in Multi Comparative column filters. For example, compare a single account to all other accounts and/or a top-performing group of similar accounts. The results update dynamically based on whatever filter is selected at the time; just pick from the filter to benchmark a different part of the organization (e.g., a different account).
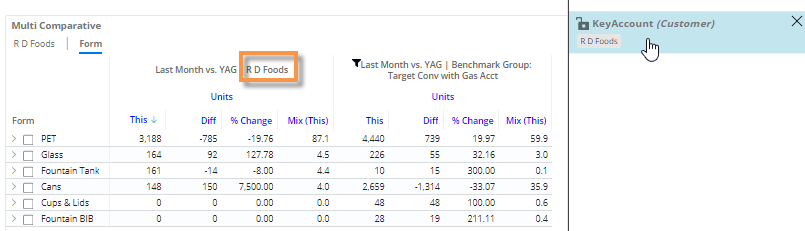
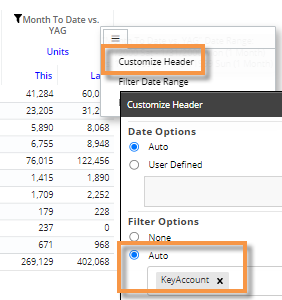
The filtered data is also available when you switch to graph format.
|
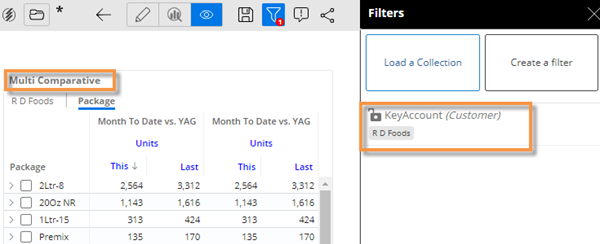
To compare performance to a benchmark |
|
|
|
|
|
|
|
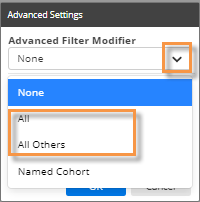
Option 1: Compare to All To show data for all members including the member you are filtered on, select All. Option 2: Compare to All Others To show data for all members except the member you are filtered on, select All Others. |
|
|
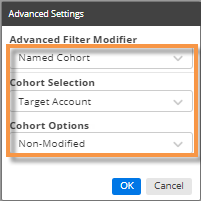
Option 3: Compare to a Cohort To show data for a custom group of members (must be pre-defined by an administrator), make the following selections and click OK. Select Named Cohort. From the Cohort Selection menu, select the name of the cohort group. The Salient Dashboards application will search within this group to find the corresponding cohort for the filter member (e.g., target account for R D Foods) and show results for the cohort member(s).
|
|
|
From the Cohort Options menu, choose from the following options to add or remove the filter member from the results:
|
|
|
|
 menu icon.
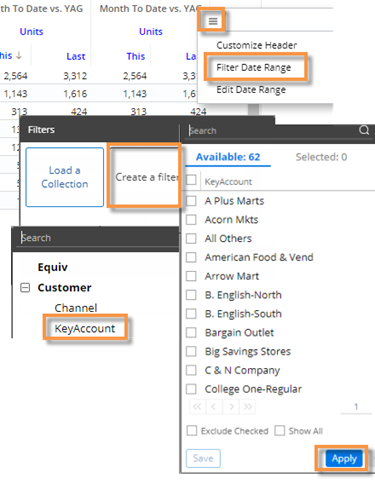
 button to access advanced settings.
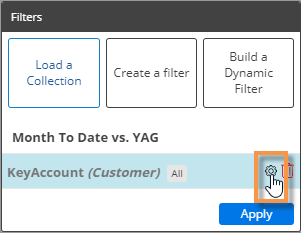
|
Tips: |
|
|
For a cohort comparison:
Depending on the dataset configuration, you may be able to include custom calculations that compare one column to another (e.g., difference between an account and a target account). This feature requires temporal measures. See the Salient Dashboards Installation and Configuration Manual for information about creating and editing cohorts. To provide automatic comparisons of user-assigned data to benchmarks (e.g., how am I doing compared to everyone else), your organization can use password collections to filter the data in a column and include another column with "all", "all others", or cohorts applied. This feature requires additional setup. |
|