Column filters (in Multi Comparative)
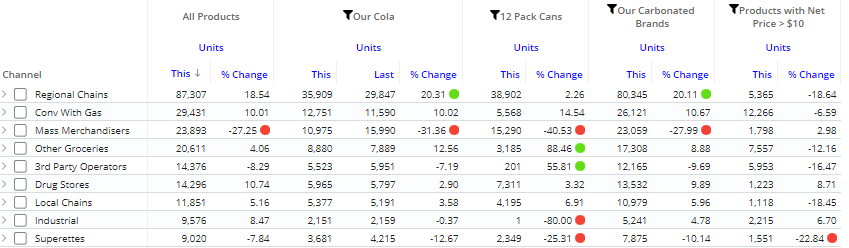
The columns in a Multi Comparative widget can be filtered on various subsets of data. The filters, date ranges, measures, and equivalents can be the same or different across columns. Any number of columns can be included to provide a customized view of performance. For example, compare performance across individual brands, packages, and custom groups of products in one view. A filter icon ![]() indicates that a column is filtered. The filtered data is also available when you switch to graph format.
indicates that a column is filtered. The filtered data is also available when you switch to graph format.
The following instructions explain how to filter individual columns. Column filters can also be set up to work with dashboard filters to compare whatever is selected to benchmarks, such as all, all others, or custom cohorts.
|
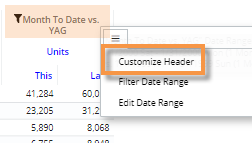
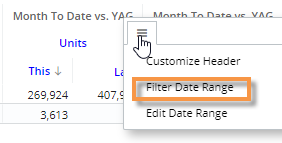
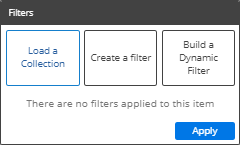
To apply a filter to a column |
|
|
|
|
|
|
 |
Tips:
• Column filters also allow you to apply equivalents to individual columns to compare converted data within a widget. Equivalents are available via the Create a filter option.
• Depending on the dataset configuration, you may be able to include custom calculations that compare one column to another (e.g., difference between one brand and all products). This feature requires temporal measures.