Crosstab widget
|
Crosstab Overview |
|
|
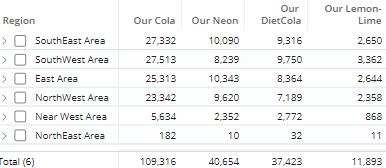
Description |
Comparison grid or graph that organizes data by two different attributes (i.e., dimensions) to examine cross-sections of data. |
|
Example |
|
|
Date range setup |
This widget shows results for one or two date ranges. Click on |
|
Group By and Cross By |
This analysis compares members of two Bys at once (1st By and Cross X By). To select a 1st By, assign it to number 1 in the Group By area. To select a Cross By, assign it to "X."
Tip: Selecting a key list as a Group By allows it to be used as a widget filter; however, data cannot be grouped at the key-list level in a Crosstab. |
|
Measures |
The grid format can show any number of measures. To select measures, click In graph setup, you can select any of the added measures to control the size and/or color of the graph components. |
|
Formats |
|
 in the widget toolbar (visible on mouseover) and select from pre-configured or custom options for "This"
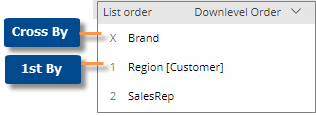
 in the widget toolbar (visible on mouseover), or