Crosstab grid
|
Crosstab grid options |
Explanation |
|
Difference and percent change (in comparisons of two date ranges) |
You can insert these columns by placing your cursor over a heading, clicking the drop-down arrow, and selecting a Delta option. |
|
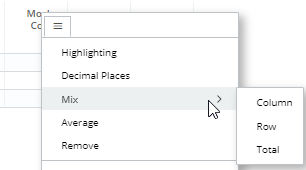
Mix (percent of totals) |
You can insert the following mix calculations by placing your cursor over a column heading (this or last values), clicking the menu icon
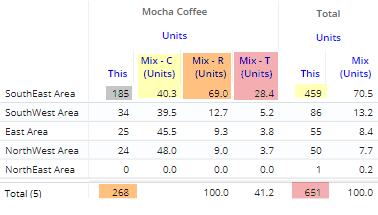
For example, the following shows Mix for Mocha Coffee in the SouthEast region:
Mix - C = 185 (Mocha Coffee in SouthEast)/459 (All brands in SouthEast) x 100% = 40.3% Mix - R = 185 (Mocha Coffee in SouthEast)/268 (Mocha Coffee in all regions) x 100% = 69.0% Mix - T = 185 (Mocha Coffee in SouthEast)/651 (total for all brands in all regions) x 100% = 28.4% |
|
Sort |
By default, Crosstab widgets use the same sort method for rows and columns; however, you can choose different sort methods via a custom sort. |
|
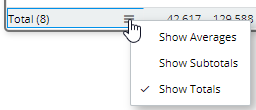
Total and average rows |
To show or hide a total row, average row, and/or subtotal (i.e., checked/unchecked)
row, place your cursor over one of these rows and click the menu icon
|
|
Highlight data |
In explore mode, you can highlight data in the grid. To access highlight settings, place your cursor over a column heading, click the drop-down arrow, and select Highlighting from the menu. |
|
In settings (in explore mode): |
|
|
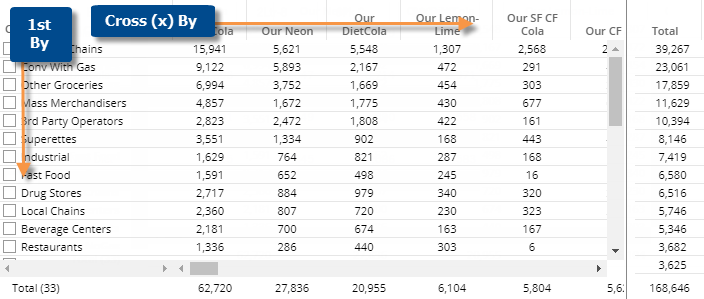
Grid page size or scrolling |
In grid settings, you can choose how many members to show per page, or turn on infinite scrolling to show all members in a single page (not available if auto-expand is on). The Column Page Size in grid settings controls how many members of the Cross By to show on one page. You cannot see members of the Cross By beyond this number. |
|
Lock Crossby |
In general settings, you can turn on the Lock Crossby setting to prevent users from changing the Cross By in view mode. |
 , and selecting a Mix option.