Exception grid
The Exception grid shows the number and percent of passing and failing key members (e.g., customers) in each member of the By. The numbers are based on an exception test. If you compare two date ranges, the grid will include This and Last and may also show difference and percent change. In addition, measure columns may be added to show actual data values.
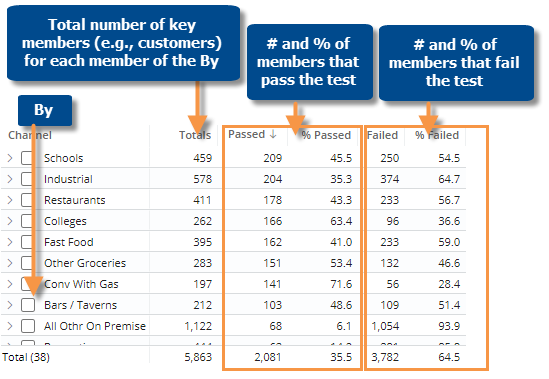
Note: The grid includes a totals column if the data is grouped by a dimension of the tested key; otherwise, the totals column is omitted.
|
Exception grid options |
Explanation |
|
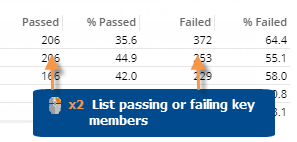
List passing/failing members |
You can double-click to list passing or failing key members (e.g., customers).
|
|
Difference and percent change |
If the grid compares date ranges, you can insert the difference and percent change in the numbers of passing or failing members. Place your cursor over a heading (e.g., Passed/This), click the menu icon
|
|
Expand members |
You can click (You cannot expand down to a "list" in an Exception.) |
|
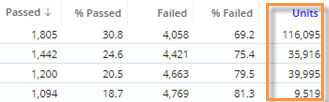
Hide columns |
Click |
|
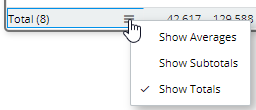
Total and average rows |
To show or hide a total row, average row, and/or subtotal (i.e., checked/unchecked)
row, place your cursor over one of these rows and click the menu icon
|
|
In grid settings (in explore mode): |
|
|
You can add measures in addition to the standard exception columns.
To add measures In grid settings, check Show Comp On Grid. The widget will show at minimum the measure used in the exception test. To add more measures, click the |
|
|
Grid page size or scrolling |
In grid settings, you can choose how many members to show per page, or turn on infinite scrolling to show all members in a single page (not available if auto-expand is on). |
 , and then select the Delta option.
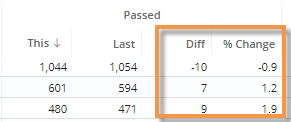
 to expand a member into the next dimension (i.e., 2nd By) if one has been defined.
 in the upper-right corner of the widget to show or hide specific exception columns (Passed, Failed, etc.).