Trend grid
The Trend grid shows measures for each date in the date range(s).
Single date range
Two date ranges (This and Last)
|
Trend grid options |
Explanation |
|
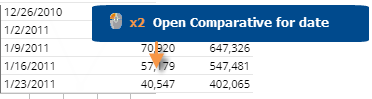
Open Comparative for date |
You can double-click on a date to open a Comparative widget for that date.
For this option to be available in view mode, the "allow spawning" option must be on in dashboard settings. |
|
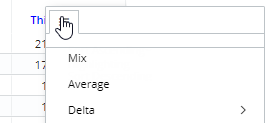
Mix, percent change, difference, etc. |
You can insert these columns by placing your cursor over a heading (e.g.,
This), clicking the menu icon If you insert mix, keep in mind that the mix values represent the percent of the total of the date range, not the percent of the total of all members. |
|
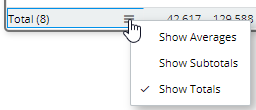
Total and average rows |
To show or hide a total row and/or average row, click on the Total/Average row in the grid. These rows show totals or averages across all dates in the date range and are calculated differently depending on the type and meaning of the data.
|
|
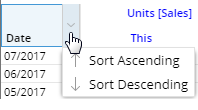
Sort by data or date |
You can sort by date (ascending/descending) or by data. Click the heading by which you want to sort.
|
|
Highlight data |
In explore mode, you can highlight data in the grid. To access highlight settings, place your cursor over a column heading, click the drop-down arrow, and select Highlighting from the menu. |
|
In grid settings (in explore mode): |
|
|
Swapped and scorecard formats |
The standard grid shows measures in columns. You can switch to a different type (e.g., swapped columns/rows or scorecard) under grid settings. |
 ,
and selecting the column to add.
,
and selecting the column to add.