Trend widget
|
Trend Overview |
|
|
Description |
Trend over time for one or two date ranges for multiple measures |
|
Examples |
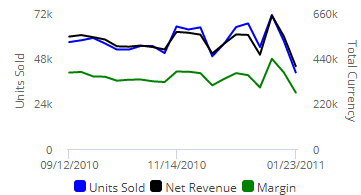
One date range:
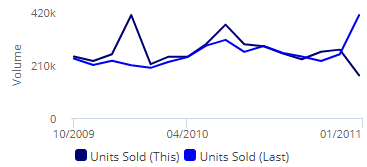
Two date ranges (i.e., Comparative Time Series):
|
|
Date setup |
This analysis shows data for each date (day, week, month, etc.) in the
date range(s). Click on |
|
Measure setup |
The widget can show any number of measures. To select measures, click Graphs are limited to the measures that use the "Show on graph" setting. This setting is on for all measures by default, but can be turned on/off for any measure. |
|
Group By/ |
This widget aggregates data rather than comparing separate groupings. Filters may be applied. |
|
Formats |
|
 in the widget toolbar (visible
on mouseover
in the widget toolbar (visible
on mouseover in the widget toolbar (visible on mouseover), or