|
Tips:
|
|
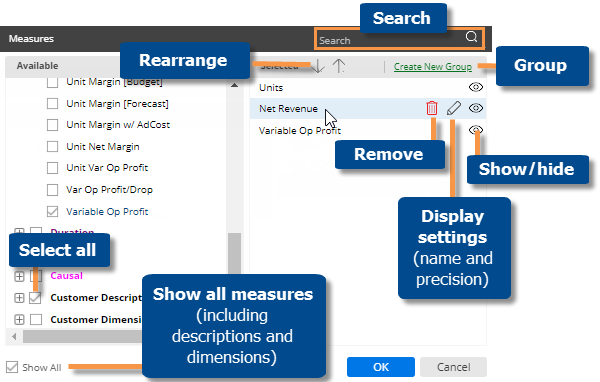
- The tools in the right pane of the dialog (see below) allow you to search for a measure, remove a measure, rearrange measures, change measure display settings, create measure groups, and show/hide measures.
- By default, the available measures depend on the context (data cube, By, etc.). You can check the Show All box at the bottom of the dialog to see all measures regardless of the context. This option also makes key descriptions (e.g., name, address, etc.) and dimensions available (requires that the key list is selected as a Group By). Measures may also be limited by the analysis type.
|
-
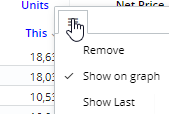
To hide a subcolumn (e.g., This or Last), click the menu icon  in its heading and select Remove. To add This or Last back, click the menu icon and select Show This or Show Last. in its heading and select Remove. To add This or Last back, click the menu icon and select Show This or Show Last.
|
|
-
If the dataset has currency tables, you can change the currency in user preferences.
-
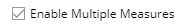
For Share Trend and Waterfall widgets, you cannot add multiple measures unless you check the Enable Multiple Measures box at the bottom of the dialog. In this case, you will be able to add multiple measures to allow selection from a list; however, the widget will still only display one measure at a time (or one calculated measure and its components in a Waterfall).
-
In an Exception widget, the measure selection tool  lets you show or hide individual exception columns (Passed, Passed %, etc.). The Measures window (i.e., Edit Measures) controls the measures that will be shown when listing members and/or when the Show Comp On Grid (in grid settings) is on. lets you show or hide individual exception columns (Passed, Passed %, etc.). The Measures window (i.e., Edit Measures) controls the measures that will be shown when listing members and/or when the Show Comp On Grid (in grid settings) is on.
-
In a Scattergram widget, you can select a measure for the x axis and a measure for the y axis or, if the widget compares two date ranges, you can check the Shared X/Y Axis Measure box to plot the Last vs. This for the same measure.
|
 all measures except those that you want to show when the dashboard initially loads.