Comparative widget
|
Comparative Overview |
|
|
Description |
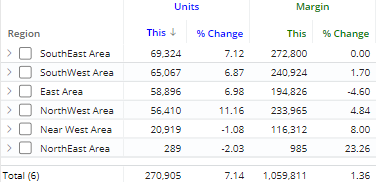
Comparison of members for one or two date ranges; any number measures. |
|
Examples |
|
|
Date setup |
This widget shows results for one or two date ranges. Click on |
|
Measure setup |
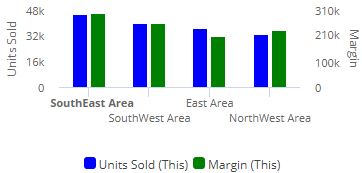
The widget can show any number of measures. To select measures, click Graphs are limited to the measures that use the "Show on graph" setting. This setting is on for all measures by default, but can be turned on/off for any measure. |
|
Group By |
This analysis compares members of the Group By. By default, data is aggregated by the top-level dimension (1st By); however, you can expand dimensions to see lower-level subgroupings (2nd By, 3rd By, etc.). |
|
Formats |
|
 in the widget toolbar (visible on mouseover) and select from pre-configured or custom options for "This"
  in the widget toolbar (visible on mouseover), or