Gauge widget
|
Gauge Overview |
|
|
Description |
A simple visual tool showing performance; single measure |
|
Examples |
|
|
Date setup |
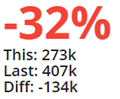
This widget shows results for one or two date ranges. Click on |
|
Measure setup |
The graphical gauges (horizontal, circle, numeric, etc.) show one measure at a time. The grid format can show any number of measures. To select the measures to show/hide, click To add measure(s), click the Measures area of the toolkit (in explore mode).
|
|
Filter By |
This widget aggregates data rather than comparing separate groupings. Filters may be applied. |
|
Formats |
Circle graph (regular gauge or solid) |
 in the widget toolbar (visible on mouseover) and select from pre-configured or custom options for "This"
  in the widget toolbar (visible on mouseover). Only measures that have been added to the widget will be available for selection using this tool.