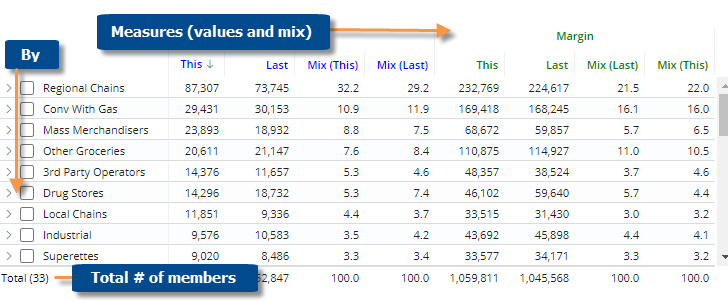
Mix grid
The Mix grid shows the percent of the total or "mix" and values for each member of the "Group By" attribute.
|
Mix grid options |
Explanation |
|
Difference and percent change (only in comparisons of two date ranges) |
You can insert these columns by placing your cursor over a heading (e.g.,
This), clicking the menu icon Mix columns are included by default. |
|
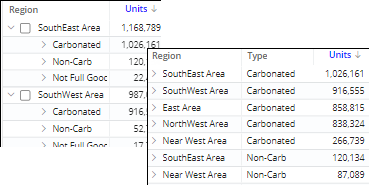
Expand members |
You can expand members to see subgroupings in the next dimension (if the widget has multiple Group By dimensions). The following methods are available:
|
|
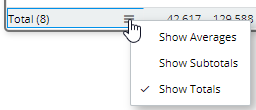
Total and average rows |
To show or hide a total row and/or average row, click on the Total/Average row in the grid. These rows show totals or averages for all members in the context—not just the current page.
|
|
Highlight data |
In explore mode, you can highlight data based on custom criteria and/or percent of the total (i.e. heatmap). To access highlight settings, place your cursor over a column heading, click the drop-down arrow, and select Highlighting from the menu. |
|
In settings (in explore mode): |
|
|
The standard grid shows measures in columns and dimension members in rows that may be expanded into a tree hierarchy. Additional grid types are available, including a flat view that expands dimensions into separate columns, swapped rows and columns, and a scorecard. To change the grid type, go to grid settings in the toolkit.
|
|
|
- Grid page size or scrolling |
In grid settings, you can choose how many members to show per page, or turn on infinite scrolling to show all members in a single page (not available if auto-expand is on). |
 ,
and selecting the column to add.
,
and selecting the column to add.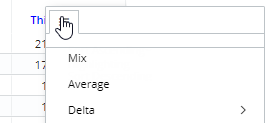
 to
expand an individual member.
to
expand an individual member.