Mix widget
|
Mix Overview |
|
|
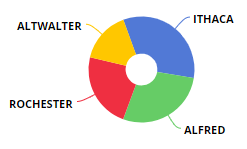
Description |
Percent of the total for multiple members for one or two date ranges; any number of measures |
|
Example |
|
|
Date setup |
This widget shows results for one or two date ranges. Click on |
|
Measure setup |
The grid format can show any number of additive measures. The graph is limited to one measure at a time (defaults to first measure). To select measures, click |
|
Group By |
This analysis compares members of the Group By. By default, data is aggregated by the top-level dimension (1st By); however, you can expand dimensions to see lower-level subgroupings (2nd By, 3rd By, etc.). |
|
Formats |
|
 in the widget toolbar (visible on mouseover) and select from pre-configured or custom options for "This"
  in the widget toolbar (visible on mouseover), or