Multi Comparative widget
|
Multi Comparative Overview |
|
|
Description |
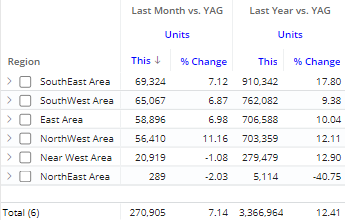
Comparison of members for any number of date ranges and measures; column filters may be applied to focus on specific subsets of data and provide dynamic benchmark comparisons. |
|
Example |
|
|
Date setup |
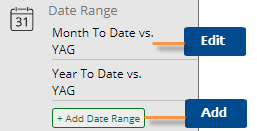
This widget shows results for any number of date ranges. Each date range can be compared to an earlier date range (i.e., Last). The default Multi Comparative includes Month to Date (MTD) and Year to Date (YTD) versus a year ago (YAG). To change a date range, mouseover a column heading in the grid, click the menu icon Date ranges can be added in explore mode. Click Add Date Range in the toolkit.
To delete a date range, click Delete at the bottom of the date dialog: |
|
Measure setup |
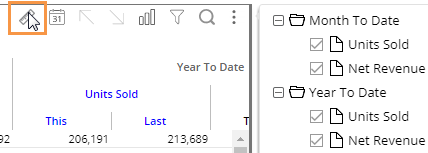
The widget can show any number of measures. By default, all the widget's measures will appear under each date range; however, users can hide/show any of these measures for any or all date ranges.
To add or remove measure(s), use the measure selection tool Users can further limit the measures that appear in graphs using the Show on graph setting in grid format. |
|
Group By |
This analysis compares members of the Group By. By default, data is aggregated by the top-level dimension (1st By); however, you can expand dimensions to see lower-level subgroupings (2nd By, 3rd By, etc.). |
|
Formats |
|

 and then Edit Measures, or click the Measures area of the toolkit (in explore mode).